

A new 8-country study measuring labor, energy, logistics, fiscal incentives, and macroeconomic stability produces a competitive map that challenges several widely-held assumptions about the region.
EXECUTIVE SUMMARY
After months of primary-source data collection across eight countries — Mexico, Guatemala, El Salvador, Honduras, Nicaragua, Costa Rica, Panama, and Colombia — MECA Investments, commissioned by Synergy Industrial Park, is publishing the 2025 Latin America Manufacturing Competitiveness Study, evaluating six core cost drivers for export-oriented manufacturing targeting the U.S. and Mexico. The data shows a clear cost advantage in Guatemala, which holds the lowest industrial energy cost in the region at $0.09/kWh and a total annual energy bill of $620,650 — $311,000 lower than Panama and $57,000 lower than Mexico — alongside fully-loaded labor costs of $645 per worker per month, 50% below Costa Rica and 38% below Mexico. In parallel, Guatemala’s 2026 bilateral framework with the United States expands preferential access while reducing non-tariff barriers, reinforcing its positioning within current trade dynamics. While Mexico maintains duty-free access under USMCA for compliant goods, that access is conditional and varies significantly depending on supply chain structure and sector exposure, with tariff exposure of ~25%+ emerging in non-compliant scenarios; Nicaragua, by contrast, maintains an estimated 18% tariff exposure across key export categories. This report is part of a multi-issue series isolating each cost dimension to provide decision-grade benchmarking for site selection.
SECTION 1 — Strategic Context: Why This Study, Why Now
The conversation about Latin America as a nearshoring destination has been building for several years. The pandemic-era supply chain disruptions that exposed the fragility of single-source, long-haul manufacturing were the first catalyst. The subsequent tariff escalation between the U.S. and China — and now the broader re-imposition of reciprocal tariffs under the Trump administration's 2025 trade framework — has turned that conversation into an operational urgency for hundreds of multinational manufacturers.
But the intelligence available to site selection executives evaluating this region has not kept pace with the urgency. Most published data is either too aggregate (country-level rankings that blend incompatible economic contexts), too dated (pre-2024 cost structures that do not reflect current labor legislation, energy tariff revisions, or freight market conditions), or too promotional (investment promotion agency materials that are structurally incapable of honest comparative analysis).
This study was built to address that gap. It covers eight countries that collectively represent the credible shortlist for export-oriented manufacturing targeting North America and Europe: Mexico, Guatemala, El Salvador, Honduras, Nicaragua, Costa Rica, Panama, and Colombia. It uses 2025 data verified against primary sources — Ministry of Labor schedules, energy regulatory filings, live Maersk freight quotes from November 2025, IMF fiscal data, World Bank governance indicators, and sovereign rating records from Moody's and S&P. And it applies a consistent methodology across all eight countries so that comparisons hold up under scrutiny.
The purpose of this opening article is not to present the final ranking — that comes in Issue 11. The purpose is to establish what the study measures, why each dimension was selected, and what the headline findings look like before we go deep on each one. Consider this the executive briefing before the technical sessions begin.
SECTION 2 — The Data: What We Measured and What We Found
The study evaluates six dimensions. Here is the headline finding for each, with the full data series to follow in subsequent issues.
Dimension 1: Macroeconomic Stability
We evaluated GDP scale and growth, international reserves, public debt-to-GDP, lending rates, sovereign credit ratings, and governance indicators. Guatemala holds the lowest public debt in the region at 26.5% of GDP — compared to Panama at 56.6%, Costa Rica at 59.8%, and Colombia at 61.3%. On sovereign ratings, Guatemala is the only country in the study whose credit outlook has remained strictly stable (Ba1 Stable / BB+ Stable) from Q1 2019 through Q4 2025. Mexico, Panama, and Colombia all experienced downgrades during the same period. Full analysis in Issue 3.
Dimension 2: U.S. Tariff Exposure (2025)
 Note: Tariff figures reflect effective exposure under current policy frameworks and assume compliance with applicable trade agreements where relevant.
Guatemala maintains preferential access across more than 70% of export categories under its current bilateral framework with the US, with remaining categories subject to an estimated ~10% tariff exposure. This positions the country competitively within the region when evaluated on effective tariff burden and access conditions. Full analysis in Issue 2.
DIMENSION 3: Fiscal Incentives and Market Access
Guatemala's ZDEEP regime offers 100% income tax exemption for 10 years, plus full exemption on VAT and import duties on inputs, machinery, and capital goods. Decree 46-2022 extended these benefits beyond the traditional maquila sector to new productive investments of any export-oriented nature. Guatemala holds 15 free trade agreements covering more than 40 countries, including CAFTA-DR (0% tariff access to the U.S. on 99.9% of exports), the EU-Central America Association Agreement, and the Mexico-Central America FTA. Full analysis in Issue 6.
DIMENSION 4: Labor Costs
All labor benchmarks are fully loaded — base minimum wage plus all mandatory employer contributions, paid leave, and national holiday obligations for 2026 — calculated per worker per month. While this provides a consistent baseline for cross-country comparison, effective labor cost competitiveness ultimately depends on hourly productivity, as statutory working hours and overtime rules vary significantly across countries. Full analysis in Issue 4.
 Source: 2025 Latin America Manufacturing Competitiveness Study; Ministry of Labor data by country, exchange rates as of January 2, 2026.
Regime Structure Plays a Key Role in Labor Cost Competitiveness
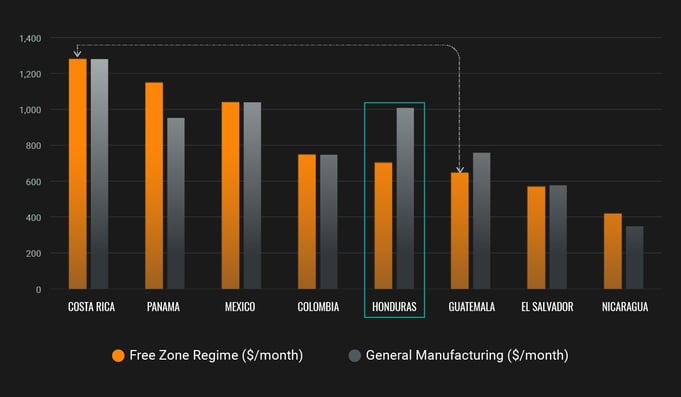
 Cost competitiveness is structurally driven by regime design, not just wage levels.
Note the inversion in Honduras: competitive in free zone ($707) but significantly more expensive in general manufacturing ($1,027) than Guatemala ($758). This is a finding that directly affects companies evaluating both regimes. Full analysis in Issue 4.
DIMENSION 5: Energy Costs
We measured base energy tariff (US$/kWh), demand charge(US$/kW-month), applicable regulatory surcharges, and modeled total annual cost for a representative industrial operation consuming 4.01 GWh per year at 750kVA contracted demand — modeled for a mid-scale continuous industrial operation with stable load profile.
Guatemala’s energy cost reflects Synergy Industrial Park’s contracted tariff structure and operating conditions, rather than a simple national average. This approach ensures a real-world, decision-grade benchmark for site selection.
Guatemala Holds the Lowest Industrial Energy Cost in the Region
 Source: 2025 Latin America Manufacturing Competitiveness Study; energy tariff data from national regulators, August 2025.
Guatemala achieves the lowest total cost despite carrying the highest regulatory surcharge rate in the region (41% applied over base energy and demand charges). Its generation and demand tariff structure is efficient enough to absorb that surcharge and still lead the region by a meaningful margin. Full analysis in Issue 5.
Dimension 6: Logistics Costs and Time-to-Market
We obtained live ocean freight quotes via Maersk in November 2025 and overland freight rates through DP World’s Landrates platform in April 2026, benchmarking shipments from each country’s capital to key U.S. and Mexico destinations. We then compared transit time and cost across both modes to assess logistics competitiveness under real operating conditions.
Cost vs Time Trade-offs Define Logistics Competitiveness
 Guatemala maintains a balanced cost–time profile across routes. To Mexico, it combines competitive cost with solid transit times, while Honduras offers faster delivery at a higher cost, reflecting a speed premium. In ocean shipping to the West Coast, Guatemala again pairs relatively fast transit with competitive pricing. Lower-cost routes like Panama and Costa Rica involve significantly longer transit times. Full analysis in Issue 7.
SECTION 3 — The Finding That Will Surprise You
The most counterintuitive result in this study is not about cost — it is about scale and opportunity.
Guatemala is the largest economy in Central America, with a 2024 GDP of $113 billion — larger than Costa Rica ($95B), Panama ($87B), Honduras ($37B), and El Salvador ($35B). It has the largest labor force in the region, with nearly 12 million people of working age and more than 60% of the population under 30. It has the most favorable energy cost structure in the region. It has a stable macroeconomic record spanning two decades. And it holds a newly negotiated bilateral framework that expands preferential access while reducing non-tariff barriers and aligning regulatory processes with its largest export market.
Yet in 2023, Guatemala attracted only $303 million in manufacturing FDI — representing just 21% of its total FDI inflow, the lowest FDI capture relative to economic size in the study. Costa Rica, with an economy 16% smaller, attracted $2,168 million in manufacturing FDI during the same year — more than seven times Guatemala's figure.
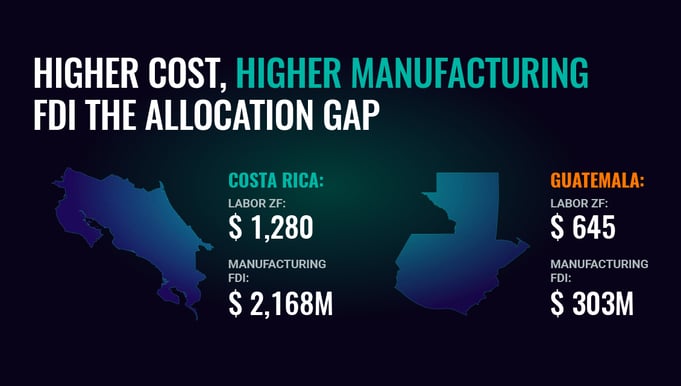
Lower cost, significantly lower manufacturing FDI capture
FDI allocation does not strictly follow cost and cannot be explained by a single factor alone. This disparity is often attributed to differences in workforce quality and educational attainment. However, while those factors are relevant, they do not fully account for the magnitude of the gap observed.
For site selectors evaluating competitive positioning, that gap represents something specific: the absence of saturation. The industrial corridors that are currently attracting investment in Costa Rica and the northern Mexico border region are running at or near capacity. Guatemala, by contrast, offers scale, available land in established industrial zones, and one of the most competitive cost structures in the region — in a market that has not yet been discovered at the rate the fundamentals justify.
Whether that gap reflects perception risk, infrastructure constraints, governance concerns, or differences in human capital — or, more likely, a combination of all four — is exactly what this study was built to assess with data rather than assumption.
SECTION 4 — Country Spotlight: Two Benchmarks at Opposite Ends of the Spectrum
Guatemala: The Structural Case
Across the six dimensions in this study, Guatemala presents the most internally consistent cost advantage of any country evaluated. It leads or places second on energy, labor (free zone), logistics to the U.S. Gulf, tariff access, fiscal incentive flexibility, and macroeconomic stability. It is the only country in the study to have maintained a completely stable sovereign credit outlook for seven consecutive years while neighboring economies experienced downgrades.
Its Logistics Performance Index score (2.6) is the second-lowest in the study, reflecting port infrastructure constraints. Combined TEU capacity at Puerto Quetzal and Santo Tomás de Castilla totals approximately 700,000 annually, compared to Panama's 9.6 million, based on port authority data and regional infrastructure estimates. Its governance indicators also rank among the weakest in the study, with low scores on corruption control (14.2) and rule of law (15.6). These are real operational considerations that any site selection process must price in.
The data-based conclusion is not that Guatemala is risk-free. It is that the cost advantage is large enough, and the macro stability durable enough, to make it a mandatory inclusion on any Central American shortlist — with governance and infrastructure constraints to be evaluated and mitigated at the project level, but priced, modeled, and mitigated at the project level — not used as blanket disqualifiers.
Costa Rica: The Premium Benchmark
Costa Rica serves as the regional standard for institutional quality. Its governance scores lead the study on every dimension: Political Stability (83.9), Rule of Law (60.4), Control of Corruption (72.6), and Economic Freedom (68.6). Its manufacturing FDI capture in 2023 ($2,168M) is the highest in Central America as a share of GDP.
The trade-off is cost. At $1,280/worker/month in the free zone regime and a total energy cost of $659,000/year, Costa Rica is 98% more expensive on labor and 6% more expensive on energy than Guatemala. For industries where institutional quality and talent sophistication justify the premium — Class III medical devices, aerospace components, advanced electronics — Costa Rica earns its position. For industries where cost efficiency is the primary constraint, the premium is difficult to defend against Guatemala's data.
SECTION 5 — Implications for Site Selectors
1. Expand your Central American shortlist beyond the conventional choices. Costa Rica and Mexico dominate the nearshoring conversation. The data in this study suggests that Guatemala deserves equal analytical weight in any evaluation targeting the U.S. Gulf, East Coast, or Mexican market — particularly for energy-intensive and labor-intensive operations.
2. Model tariff exposure as a cost line item, not a risk footnote. ~25% tariff exposure on non-compliant goods exported from Mexico to the U.S. is not a geopolitical risk — it is a cost variable that directly affects landed cost. Mexico maintains 0% duty access under USMCA for compliant goods, but exposure varies depending on supply chain structure and sector. The difference between Guatemala’s treaty-covered access on more than 70% of exports and Nicaragua’s ~18% exposure, on a $50M annual export program, is approximately $9 million per year. Build it into your model.
3. Use fully-loaded labor cost, not minimum wage. Employer contribution rates in this region range from 39.5% (Mexico) to 67.7% (Colombia). Minimum wage headlines are not comparable across countries without normalizing for mandatory social charges, holiday pay, and productivity bonuses. This study's labor benchmarks are fully loaded — use them.
4. Run the total energy cost model, not the tariff rate. Guatemala's base tariff of $0.09/kWh looks modestly competitive. Its total annual cost at scale — $620,650 — is $311,370 lower than Panama and $57,450 lower than Mexico. The spread between headline tariff and total cost is significant enough to change location decisions for energy-intensive operations.
5. Treat governance scores as inputs to risk modeling, not as binary qualifiers. Guatemala's scores on corruption and rule of law are materially lower than Costa Rica's. They are also materially better than several other countries in this study on political stability. The right analytical approach is to quantify what governance risk means for your specific operation — not to accept or reject a location on a single composite score.
The 2025 Latin America Manufacturing Competitiveness Study is available in full to qualified site selection executives and advisory teams. Over the coming months, this series will publish 12 deep-dive issues, each isolating a single cost dimension with full data tables, country comparisons, and sector-specific analysis.
Issue 2 will be released next: The Tariff Shock That's Redrawing the Latin America Manufacturing Map — a full analysis of U.S. reciprocal tariff exposure by country and what it means for landed cost calculations in 2025 and beyond.
To receive each issue directly, subscribe at Synergy Industrial Park website. To request a full briefing or access to the complete study data, industrialpark@synergy.com.gt.
Latin America Manufacturing Intelligence Report | Issue 1 of 12 | 2025 Latin America Manufacturing Competitiveness Study: An 8-Country Benchmark for Export-Oriented Site Selection Published by Meca Investments — Regional Site Selection Advisory Data current as of Q4 2025